Excel Add-in
Yesplan’s Excel Add-in allows you to insert a dataview into a worksheet as an Excel table:
- You can refresh the table so that it reflects the contents of your dataview in Yesplan. If the values in your dataview change, your table in Excel changes along.
- For certain types of custom data fields, you can write values back from Excel to Yesplan.
- If the structure of the dataview changes (e.g. a new column), you can also refresh the structure of the table in Excel.
The Excel Add-in allows you to use values from Yesplan dataviews for calculations, graphs, to validate data etc.
Before You Start§
Before you get started, it’s not a bad idea to keep the following in mind.
Supported Versions of Excel§
The Excel Add-in works with the following versions of Excel:
- Microsoft 365 (subscription): any version released after June 2020
- Office (one-time purchase): Office 2021
Tip
You can find more information about the different formulas on Microsoft’s website:
Agreements§
The Excel Add-in is a powerful tool. After all, you can call up various fields in Yesplan at the touch of a button, but also edit them. Editing may also have less pleasant consequences, which is why we recommend using it responsibly:
- Make sure that the permissions for your installation and dataviews are configured properly. Who gets permissions to read this dataview? Who is allowed to view or edit custom data fields?
- Also make clear agreements about writing back data to Yesplan. Who can write back data? For what purpose?
- Keep an overview of who is using the Excel Add-in in your organization, and for what purposes.
Writable Fields§
You can use the Excel Add-in to write back values to Yesplan for the following types of custom data fields:
- Input field, numeric input field and text field
- Date input field, time input field and date and time field
- Checkboxes, drop-down menu and yes/no field
- Integration data
Remark
You can’t write system fields (e.g. status, location etc.) back to Yesplan.
Concepts§
Below, you find the definitions of some concepts in the Excel Add-in.
Data Flow§
To keep everything organized, you can define the data flow in the Excel Add-in. You can do this by clicking “Configure” for a table in the Excel Add-in menu. This opens the “Link the Columns” window, which contains three columns:
- The column “Yesplan Dataview” contains the columns of the dataview.
- The middle column “Data Flow” contains arrows to the right or left, in gray, blue or red.
- The column “Excel Table” contains drop-down menus containing columns of your Excel table.
The arrows have the following meanings:
- An arrow to the right means fetching values from the dataview to the Excel table:
- Gray: For this column, the values from the dataview don’t appear in the Excel table. In the drop-down menu, “No Column” is then selected.
- Blue: For this column, the values from the dataview do appear in the Excel table. The exact column is selected in the drop-down menu under “Excel Table”.
- Red: There is a problem with linking the columns. In that case, an error message appears.
- An arrow to the left means writing back values from the Excel table to the dataview:
- Gray: For this column, no values are written back to the dataview. In the drop-down menu, “Do Not Write” is then selected.
- Blue: For this column, values are written back to the dataview. The exact column is selected in the drop-down menu under “Excel Table”.
- Red: There is a problem with linking the columns. In that case, an error message appears.
Tip
The left arrow only appears if you can actually write the field back to the dataview. See Writable Fields for more information.
Column Sets§
A column set is a collection of columns in your Excel table. You use such a set to write back the values from a limited number of columns. That way, you can create different actions within one table to write values back to the dataview, for example:
- Write back ticket prices using the ‘Tickets’ column set. This contains the columns ‘Price Rank 1’, ‘Price Rank 2’, and ‘Price Rank 3’.
- Write back profit distribution using the ‘Shares’ column set. This contains the columns ‘Total Profit’, ‘Artist Share’, and ‘Venue Share’.
Installation§
To open dataviews in Excel, you must have the Add-in activated in your Yesplan installation, and add the Add-in itself in Excel.
Activate§
The Excel Add-in is a paid module of Yesplan. Therefore, this module needs to be activated in your installation of Yesplan first:
- Contact support@yesplan.be to have the Excel Add-in activated.
- Once the module is activated, you can get started with the Excel Add-in.
Add§
First, check in your preferences for Excel whether your privacy settings allow you to install external add-ins:
- In macOS:
- In the Excel menu, select “Excel” > “Preferences…”.
- Click “Privacy”.
- The checkbox next to “Turn on optional connected experiences” must be selected.
- In Windows:
- In the Excel menu, select “File” > “Options”.
- Click “Trust Center” and then “Trust Center Settings…”.
- Click “Privacy Options” and then “Privacy Settings…”.
- The checkbox next to “Turn on optional connected experiences” must be selected.
Remark
You can find more information on this setting on the Microsoft website: Overview of optional connected experiences in Office.
You can add the Excel Add-in yourself to Microsoft Excel via the AppSource:
- Open Microsoft Excel and go to your add-ins:
- Click the “Insert” tab of the ribbon and then click “Get Add-ins”.
- In macOS, you can choose “Insert” > “Add-ins” > “Get Add-ins” from the menu.
- In the window that appears, search for “Yesplan”.
- Click “Add” next to “Yesplan Dataviews Add-in”. Click “Continue” if you agree to the license terms and privacy policy.
- The Excel Add-in appears in the “Home” tab on the ribbon.
Attention
It’s possible that you don’t have access to the AppSource because your organization manages Microsoft add-ins centrally. In such cases, your IT department needs to install the Excel Add-in. It’s possible to install the Add-in for only a limited number of users in an organization. You can find more information on the Microsoft website:
Preparations in Yesplan§
Before you get started with the Excel Add-in, you need to set up a few things in Yesplan.
Integration Data§
With the Excel Add-in, you can fetch data from Yesplan and write back the values of certain types of custom data fields there. However, you will want to protect some data so that you can edit it from the Excel Add-in, but not in Yesplan itself. This can be done with a custom data field of type “Integration data”, which supports the following data types:
- Single-line text
- Multi-line text
- Number
- Date
- Time
- Date and time
- Single option
- Multiple options
To make an integration field writable from the Excel Add-in, you must explicitly specify this in the System Settings:
- Go to “System Settings” > “Integrations” > “Excel Add-in”.
- Add the keyword of the custom data field in question to the appropriate table.
- You can now edit the field via the Excel Add-in, but not in Yesplan.
Integration data can be useful if, for example, you send back values to Yesplan that are the result of a calculation in Excel: ticket prices, profit distributions, sales targets etc. As a consequence, you can only edit them from Excel.
Tip
See Types of Custom Data Fields for more information about integration data.
Creating a Dataview§
The Excel Add-in retrieves data from a dataview and displays it in a table. To do this, you obviously need to create a dataview in Yesplan.
Tip
See Dataviews for more information.
To use the dataview effectively with the Excel Add-in, we recommend the following steps:
- Add the Yesplan ID as a column to the dataview, as this must be present if you want to write back data from the Excel Add-in:
- This is the Yesplan ID of the element that is the scope of the dataview.
- For example, in a dataview for events, this is the ID of the event.
- Set the dataview permissions correctly. Who can view the dataview? Who can edit it? However, you can’t set writing back via the Excel Add-in as a separate permission.
- We advise to lock the dataview. A locked dataview must be unlocked before you can save changes to it. In this way, you avoid unwanted changes to dataviews used by the Excel Add-in.
Warning
We don’t recommend editing a dataview if it’s already used by a lot of people in the Excel Add-in. New filters, columns and especially the removal of columns can change the behavior of tables in Excel.
Use§
Signing In§
Perform the following steps to sign in to the Excel Add-in:
- Click the Excel Add-in in the “Home” tab on the ribbon.
- Enter the URL of your installation (e.g.
rockit.yesplan.be), and sign-in to Yesplan.
Navigation§
At the top of the Excel Add-in, you will see various buttons:
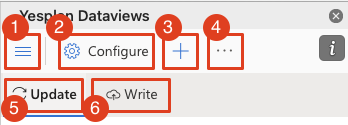
- Selection menu: Contains all the tables in your Excel file.
- Configuration: Configure the data flow between Yesplan and Excel here.
- ’+’ icon: Insert a new table that is linked with a dataview.
- Options: You can perform various actions here:
- Unlink Dataview: Unlink the dataview and the currently selected table. The table remains in Excel, but is no longer linked to a dataview in Yesplan.
- Refresh Dataview Structure: Retrieve changes to the structure of the dataview, such as modified columns, filters and parameters. This is done automatically every time you log in to the Excel Add-in.
- Manual: Link to this manual.
- Refresh: This tab allows you to fetch data from the dataview.
- Write: This tab allows you to write data to the dataview.
Inserting a Table§
In the steps below, we explain how to insert a dataview as a table via the Excel Add-in:
- Select a cell in your Excel worksheet (e.g. A1). You will insert the table with the dataview there.
- In the Excel Add-in, click the ‘+’ icon.
- Choose a dataview from the drop-down menu under “Insert Dataview as Table”. If the dataview contains parameters, you can enter or edit them in the Excel Add-in.
- Click “Insert Table”.
Refreshing a Table§
You can refresh an Excel table with information from the dataview in Yesplan in two ways:
- Fetch the contents of fields from the dataview. You will only refresh the values of the cells in your table.
- Refresh the structure of the dataview, for example, by fetching new parameters or columns. The parameters, filters and behavior of your columns may change.
Refreshing the Contents of a Table§
Use this action if you want to fetch the most recent data from Yesplan. You will only refresh the values of the cells in your table:
- In Excel, first click the table in question to select it.
- Click the “Refresh Table” button in the “Refresh” tab.
- The table is refreshed and now contains the values of the dataview in Yesplan.
Refreshing the Structure of a Dataview§
Use this action if the structure of your dataview (columns, parameters, filters etc.) has changed in Yesplan:
- In Excel, click the table in question to select it.
- Click the options menu (the three dots) and then click “Refresh Dataview Structure”.
Remark
The structure of your dataview also changes when you open a saved Excel file that contains a linked table. If you sign in to Yesplan in this file via the Excel Add-in, the structure of the dataview will automatically refresh.
If the structure is refreshed, you can edit the existing table:
- Filters and parameters are automatically changed in the Excel Add-in.
- Deleted columns remain in the table, but their contents will no longer be refreshed. These columns are therefore no longer linked to the dataview. For that reason, we recommend removing these columns from the table as well to avoid confusion.
- You must link new columns to new columns in the table. Suppose the column ‘Sold in Pre-Sales’ is added to the Yesplan dataview:
- Add a new column to your Excel table and give it a clear title, e.g. ‘Pre-Sales’.
- In the Excel Add-in, click “Configure”.
- Under “Yesplan Dataview”, search for ‘Sold in Pre-Sales’. Next to it, you will see a gray arrow to the right and a drop-down menu.
- In this drop-down menu, choose the column you just created, ‘Pre-Sales’.
- The blue arrow indicates that the two columns are now linked.
- Close the configuration window and click “Refresh Table”. The ‘Pre-Sales’ column in your table will be populated with data from the ‘Sold in Pre-Sales’ column in your dataview.
Tip
See Data Flow for more information on the meaning of the arrows, their direction, and their colors in the configuration screen.
Unlinking a Dataview§
Use this action to keep a table in Excel, but no longer link it to a dataview in Yesplan:
- In the navigation menu at the top of the Excel Add-in, click the option button (with the three dots).
- Select “Unlink Dataview”.
Writing Back§
You can use the Excel Add-in to write values back to Yesplan:
- Only certain types of custom data fields allow this. See Writable Fields for more information.
- To write values back, your dataview must contain a column for the Yesplan ID. See Creating a Dataview for more information.
- Changes via the Excel Add-in appear on the “History” tab of inspectors.
- You can also write back values that have been calculated in Excel. For example, you can:
- Fetch the number of tickets sold for rank 1, 2 and 3.
- Add up these numbers in a new column to calculate the total number of tickets sold.
- And write the new column with the total back to a column in your dataview.
Attention
- Once you write data back to Yesplan, you can’t automatically undo this. The Excel Add-in is powerful, but this can also have drawbacks.
- We advise that you don’t write data back to a dataview with the scope “Events and Event Groups” because the inheritance between groups and events also plays a role here and can have unpredictable consequences. See Excel Add-in and Inheritance for more information.
Setting Up a Data Flow§
Before you can write back data, you must link the columns of your table and your dataview so that the data ends up in the correct column. Suppose you want to write values in the ‘Rank 1’ column from your table back to the ‘Price for Rank 1’ column in your dataview:
- In Excel, first click the table in question to select it.
- Click “Configure” in the menu.
- Under “Yesplan Dataview”, search for ‘Price for Rank 1’:
- If there is a gray arrow to the left, you don’t write back data to the dataview: in the drop-down menu, “Do Not Write” is selected.
- In this drop-down menu, select the ‘Rank 1’ column. The arrow pointing left turns blue to indicate that you write back values.
- Then select a column set from the drop-down menu on the far right to write back the data, or click the three dots next to the drop-down menu to create a new set. For example, we select a column set entitled ‘Ticket Prices’.
- Close the window once everything is set up correctly.
Writing Back Values§
Once the data flow and column set are specified, you can write values back to Yesplan:
- In your table, select the rows for which you want to write back data.
- In the Excel Add-in, go to the “Write” tab.
- Click ‘Write Ticket Prices’ where ‘Ticket Prices’ is the column set you want to write back.
Warning
The inheritance of values from custom data fields can lead to unpredictable consequences in the Excel Add-in if you write back values. See Excel Add-in and Inheritance for more information.
Frequently Asked Questions§
Renaming Tables§
How do you rename a table? You can read this on the Microsoft website: Rename an Excel table.
Excel Add-in and Inheritance§
The inheritance of custom data is an important principle in Yesplan. However, it can cause confusion if you use the Excel Add-in. After all, it writes the rows in a table back to Yesplan in the order in which they appear.
Warning
We advise to not write data back to a dataview with the scope “Events and Event Groups” because the inheritance between groups and events plays a role here and can have unpredictable consequences.
Let’s assume the following situation:
- We have an event group ‘Shakespeare Festival’.
- The event ‘Hamlet’ is part of this event group.
- They both contain the custom data field ‘Ticket Price’.
How are values written back to Yesplan?
Group Before Event§
Suppose the table in the Excel Add-in looks like this, where 35 and 25 are new values:
| Yesplan ID | Name | Type | Ticket Price | |
|---|---|---|---|---|
| 1 | 165328129-1638521548 | Shakespeare Festival | Group | 35 |
| 2 | 723062273-1638533586 | Hamlet | Event | 25 |
You select rows 1 and 2, and write the ticket price back to Yesplan. Which values will be found there?
- ‘Shakespeare Festival’ will include for the ticket price the value 35. This value is sent first.
- ‘Hamlet’ will contain the value 25. This value is sent second, and overwrites the value of the group.
Overwritten Fields§
You can’t restore the value of an overwritten field via the Excel Add-in. In the example above, the ticket price is overwritten on ‘Hamlet’: 25 instead of 35 on the parent group ‘Shakespeare Festival’:
- You can write back the value 35 in the Add-in for ‘Shakespeare Festival’, but this won’t change the value of ‘Hamlet’: 25 is still the overwritten value there.
- You can change the value for ‘Hamlet’ back to 35 in the Add-in and write that back, but in Yesplan this field will remain marked as a field with an overwritten value.
- The inheritance isn’t restored from the Add-in until you write back a new value, only for row 1 with ‘Shakespeare Festival’, e.g. 40:
- The group ‘Shakespeare Festival’ will have the value 40, as expected.
- The event ‘Hamlet’ will now also have the value 40 because the field ‘Ticket Price’ inherits this value from the group.
Event Before Group§
What if the table looks like the following, with 20 and 15 as the new values?
| Yesplan ID | Name | Type | Ticket Price | |
|---|---|---|---|---|
| 1 | 723062273-1638533586 | Hamlet | Event | 20 |
| 2 | 165328129-1638521548 | Shakespeare Festival | Group | 15 |
You select rows 1 and 2, and write the ticket price back to Yesplan. Which values will be found there?
- ‘Shakespeare Festival’ will include for the ticket price the value 15. This value is sent last.
- ‘Hamlet’ will contain the value 15:
- First, the value 20 is sent for ‘Hamlet’.
- This value is then overwritten at the group level with the value 15.
Editing the Value at Group Level§
What if the table looks like the following, with 45 as the new value?
| Yesplan ID | Name | Type | Ticket Price | |
|---|---|---|---|---|
| 1 | 165328129-1638521548 | Shakespeare Festival | Group | 45 |
| 2 | 723062273-1638533586 | Hamlet | Event | 15 |
You only select row 1, and write the ticket price back to Yesplan:
- The event ‘Hamlet’ will be given the value 45 in Yesplan, but this isn’t automatically shown in the Add-in.
- In the Add-in, click “Refresh Table” from the “Refresh” tab to fetch the correct value.
Warning
The Add-in only overwrites a value in Yesplan if it’s a new value:
- Yesplan already contains the value 45 for the group ‘Shakespeare Festival’: writing back the value 45 won’t change anything on the group or underlying events.
- Yesplan contains the value 100 for the group ‘Shakespeare Festival’: writing back the value 45 will change the value to 45 on the group and underlying events.
Hidden Rows§
Can you hide rows in a table that is linked with a dataview in Yesplan? In the example below, rows 3 and 4 are hidden.
| Yesplan ID | Name | Type | Ticket Price | |
|---|---|---|---|---|
| 1 | 165328129-1638521548 | Shakespeare Festival | Group | 45 |
| 2 | 723062273-1638533586 | Hamlet | Event | 30 |
| 5 | 724993025-1638533581 | Othello | Event | 30 |
We advise against this, especially for a dataview with the scope “Events and Event Groups”:
- If you select multiple rows by dragging the cursor, or selecting them with the Shift key, and then write them back to Yesplan, then you will also write back the hidden rows 3 and 4.
- In combination with inheritance, this may cause confusion. See Excel Add-in and Inheritance for more information.
- When refreshing the table with data from the dataview, the hidden rows will always pop up again. You will therefore have to hide them time and again.
Relinking a Table§
In the options menu, you can unlink a table and the dataview (see Navigation for more information). However, how can you relink the table and the dataview?
- In Excel, click the table in question to select it.
- From the drop-down menu under “Select the dataview to link with”, choose the dataview to link with.
- Click “Link Table”.
Tip
Once the table is relinked to the dataview, you need to reset the data flow. See Data Flow and Setting Up a Data Flow for more information.